Why a Fast Computer Can Still Feel Slow
Performance Analysis 101 - Part 1
You click something and there is a small delay. You change a browser tab and it takes a moment. A webpage is scrolling smoothly, then suddenly it catches somewhere. Or maybe you ask an AI application something… and wait before anything even starts happening.
We normally put all of this into one simple statement: “My computer is slow.”
But… what does that actually mean?
Computers today are ridiculously fast compared with what most of us were using ten or fifteen years ago. We have processors with many cores, lots of RAM, fast SSDs, powerful GPUs. Even our phones are very powerful computers.
And still… we wait.
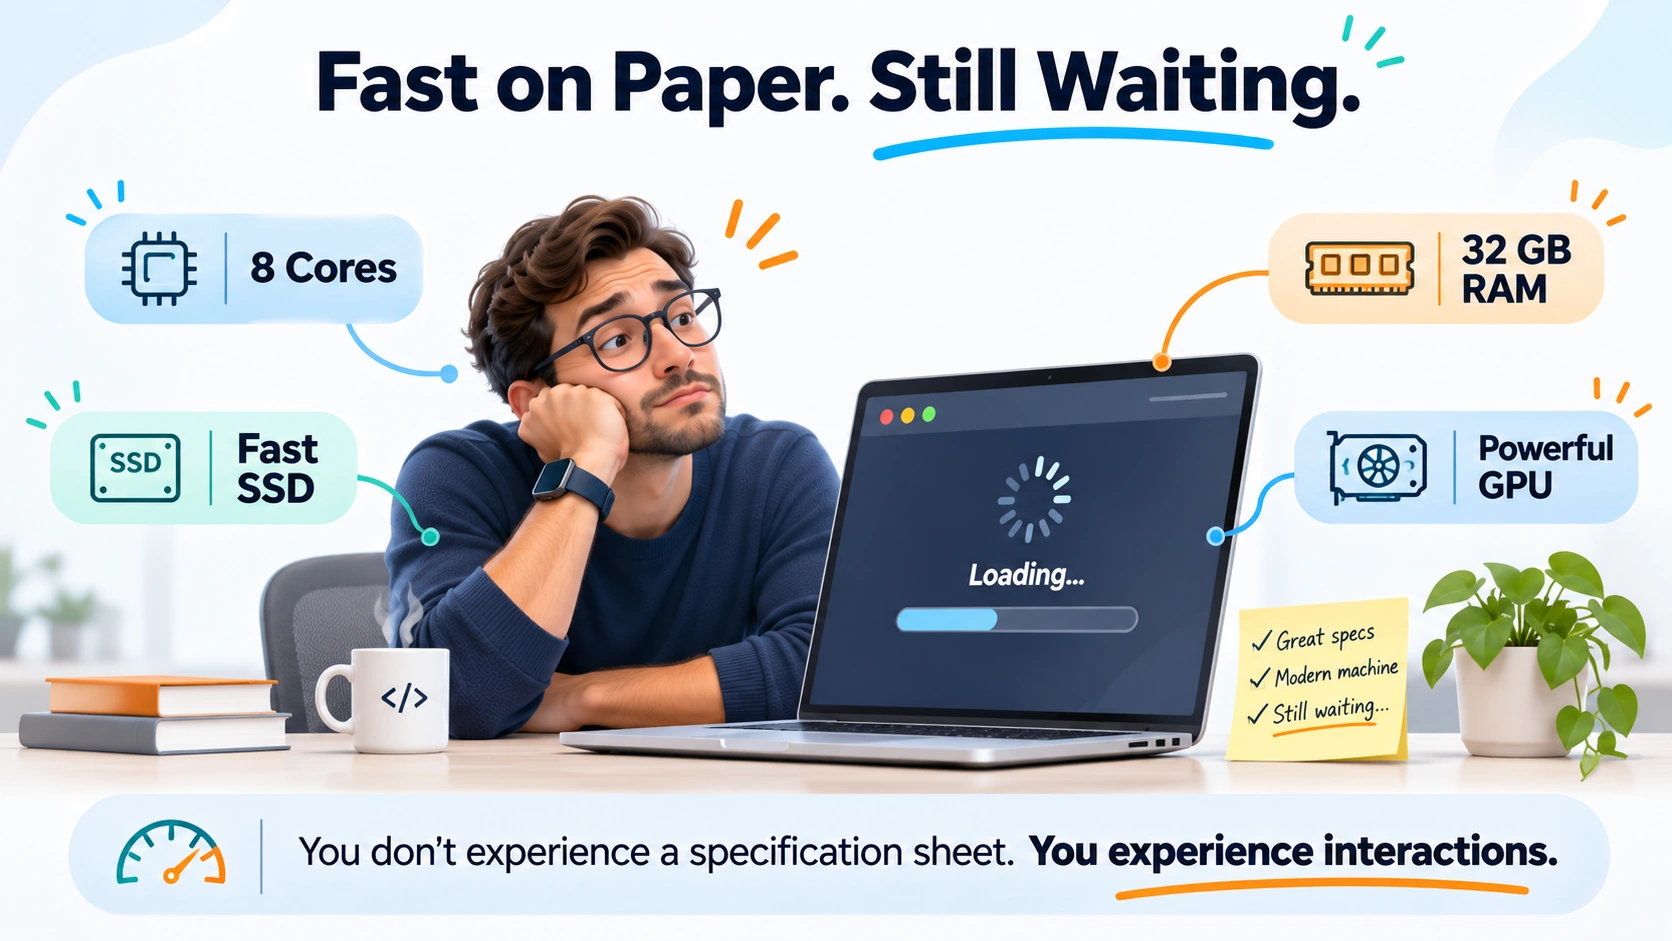
I want to start this series here, with the waiting. Performance Analysis 101 is for graduate engineers and people beginning their engineering careers. No profiling or processor-pipeline knowledge is needed for this first post.
This first part introduces a way of asking questions. Part 2 examines whether spare CPU capacity can help the work holding us up. Part 3 follows that work into the memory hierarchy.
First, where does the waiting come from?
What Exactly Became Slow?
Let’s take something almost everybody uses. A browser. Chrome, Edge, Safari… whatever.
Suppose you say, “My browser has become slow.”
Okay. Did the webpage take too long to download? Or did it already load, but clicking a button takes time? Is scrolling jerky? Is typing delayed? Does switching between tabs take time?
Does only one particular website behave badly while everything else is fine? Or does the whole machine become sluggish after you open thirty or forty tabs?
All of these feel like “browser is slow”. They can be very different problems.
Before asking why something is slow, we should understand what exactly is slow. A useful description names the action, the result we expected, and the conditions under which it happens.
“The browser is slow” gives us very little to investigate. “On this website, clicking Search sometimes leaves the results unchanged for about half a second, even after the page has loaded” gives us somewhere to start.
We still don’t know the cause. That is fine. We haven’t measured it yet.
Between the Click and the Result
Suppose I click a button inside a web application and expect a result on the screen.
Between those events, quite a lot may happen. The browser receives my input, but the code handling it may have to wait for other work. Then some JavaScript runs. Perhaps the application needs data, so it sends a network request. A server processes the request and sends a response back. The browser processes that response and updates the page.
Calculating element positions, drawing their appearance, and combining visual layers involve work such as layout, painting, and compositing.
The path depends on the application. Some work can overlap; a local button may need no network request.
From my point of view, though, the experience is simple: I did something, I waited, and something useful happened.
The elapsed time between the start and the result we chose is latency. We need to say what those endpoints are. Time until the button shows a spinner and time until the requested results appear are two different measurements.
That distinction matters even with established browser metrics. Interaction to Next Paint, or INP, concerns responsiveness through the next paint after an interaction. It does not measure every later effect, such as completing an asynchronous request and displaying its final result. A quick spinner can provide useful feedback while the result is still on its way.
Here, I am interested in the delay until the requested result becomes visible.
Inside that journey, dependencies determine when we can finish. If two pieces of work run in parallel and the result needs both, the slower branch holds up the result. The dependency path that determines completion time is the critical path. It includes waiting as well as execution.
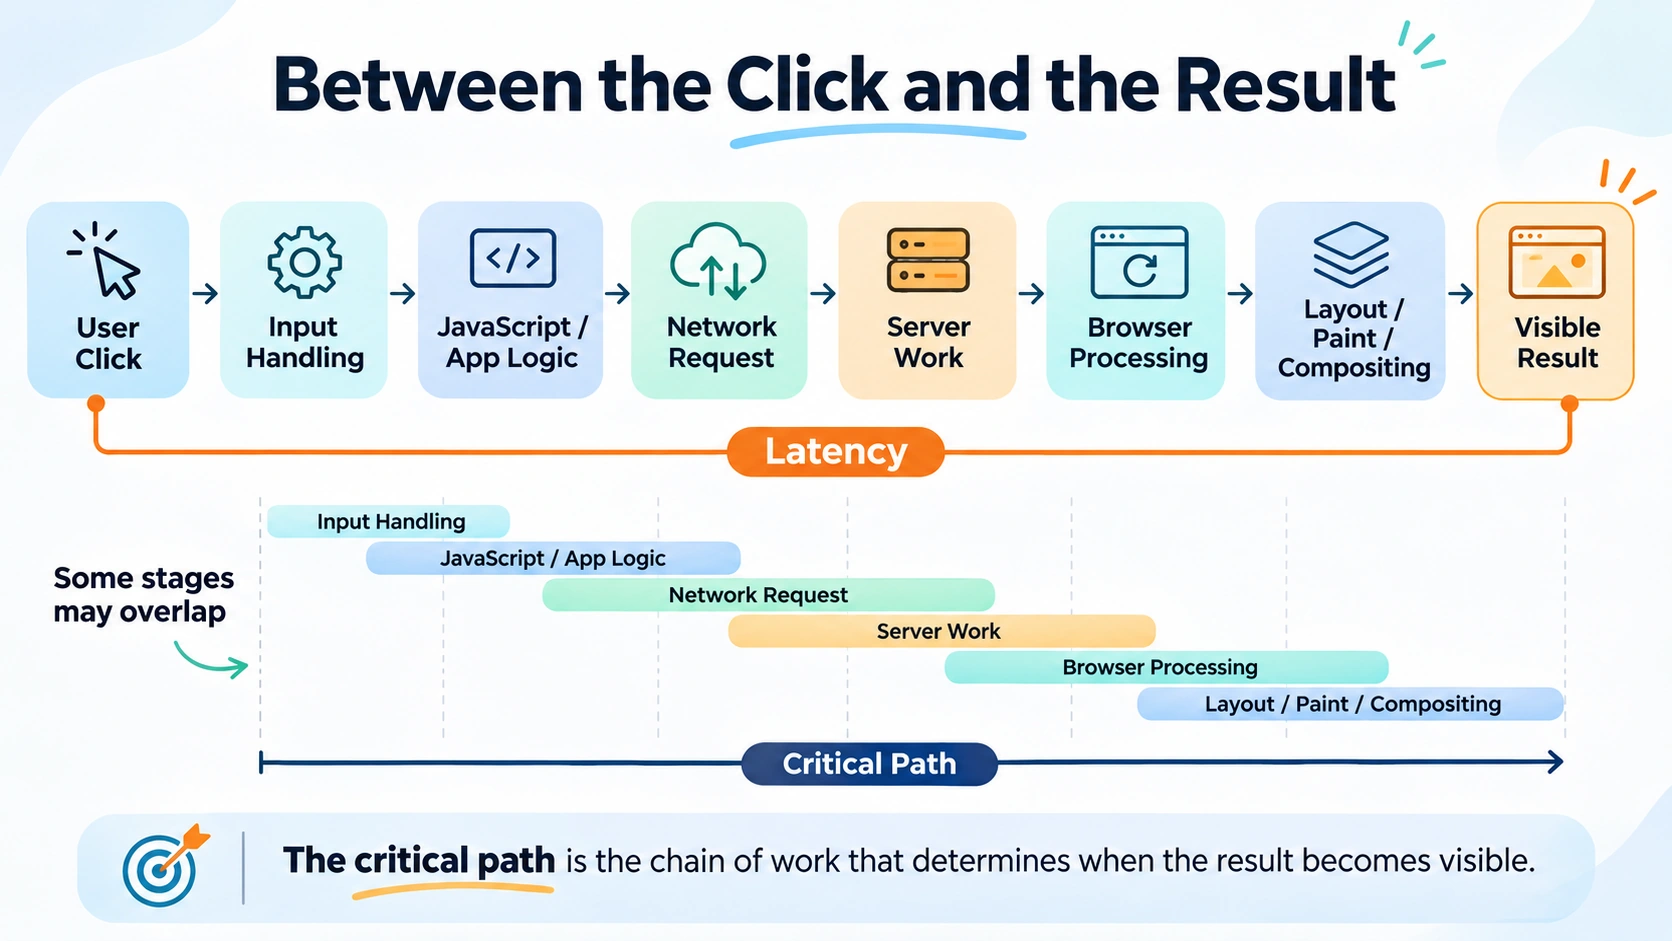
An eight-core processor, powerful GPU, and fast SSD are all great. But if something on the path I am waiting for is delayed, I still wait.
Speeding up work elsewhere might make no difference to this interaction.
Thirty Percent CPU, and Still Waiting
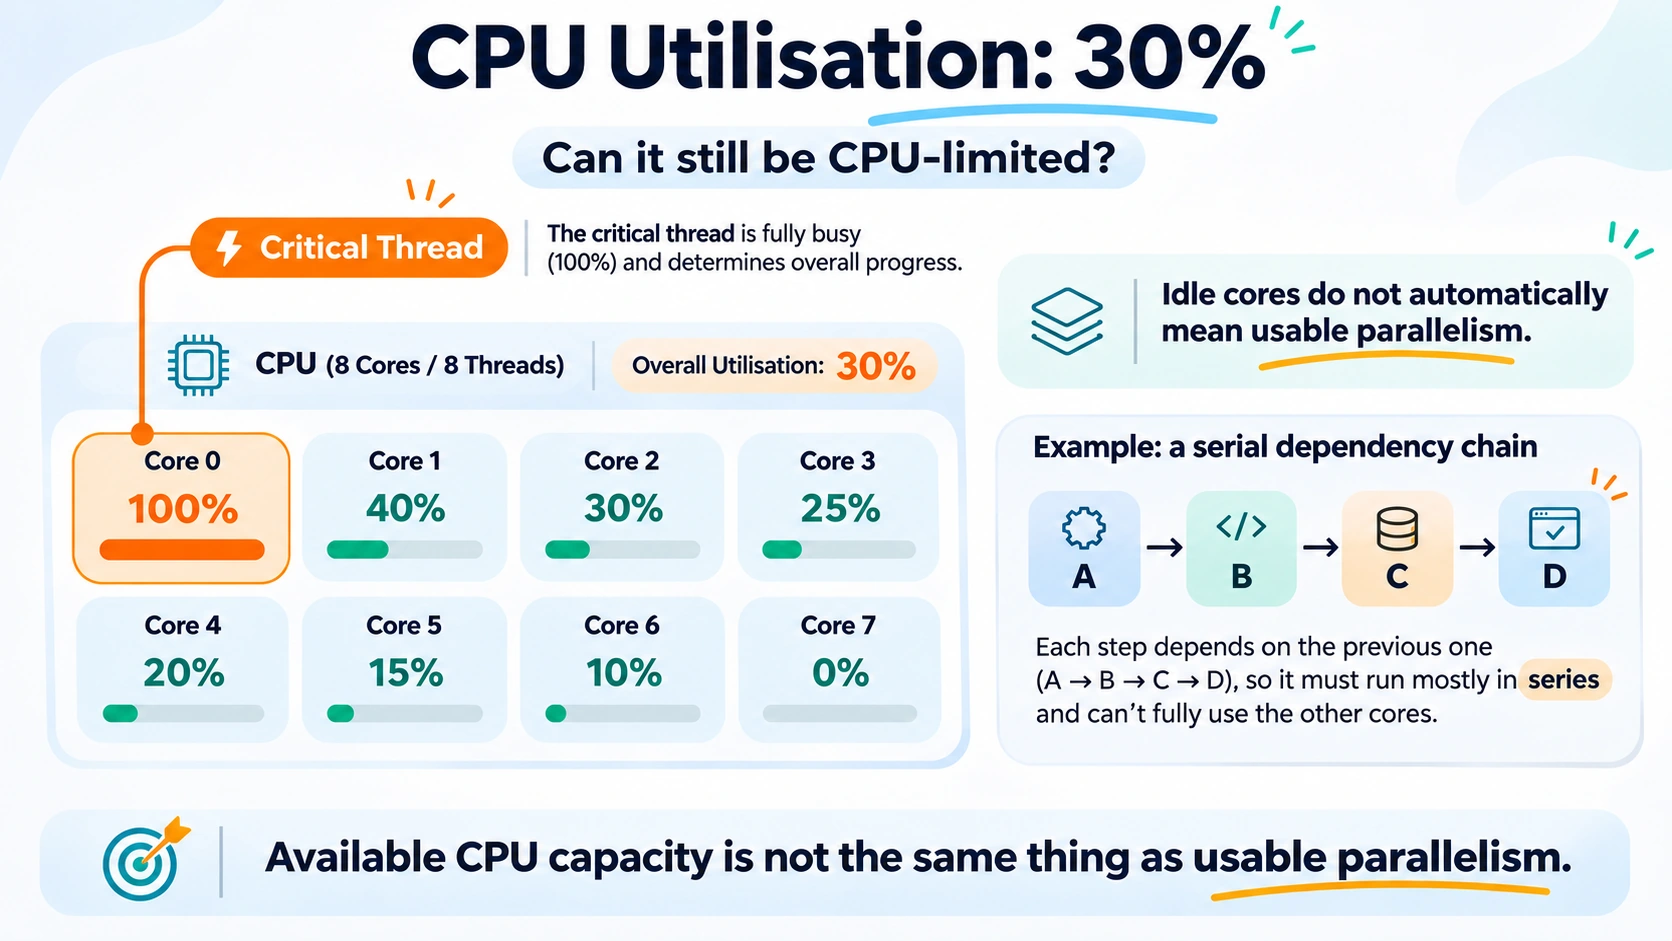
Now suppose the browser feels sluggish and I open Task Manager. CPU utilisation: thirty percent.
So the CPU cannot possibly be the problem. Right?
Well… what exactly does that thirty percent tell us?
A browser has multiple processes and threads. A thread is a sequence of execution the operating system can schedule. Having many threads and many CPU cores available does not mean every piece of work can use all of them independently.
Maybe an important browser thread is occupied with long JavaScript work. Maybe layout must complete before the next update. Maybe one thread needs a result from another. There may be a serial dependency: one step has to finish before the next can begin.
The total figure combines activity across the machine over a measurement interval. Microsoft’s CPU analysis documentation distinguishes aggregate usage from the threads contributing to a delay. Part 2 will unpack that thread-level view.
Spare capacity elsewhere does not automatically help the thread holding up your interaction. A brief burst may also disappear into a longer averaging interval.
The thirty-percent number isn’t wrong. Perhaps I was asking it to answer something it cannot answer by itself.
The measurement may be perfectly correct. The interpretation may still be incomplete.
For now, keep the question: can the work holding me up actually use that unused CPU?
Where Did Those Two Seconds Go?
Take another situation. I click something and the result takes two seconds to appear.
Perhaps the network is taking time. Or the network is fine, but the server spends one and a half seconds processing my request. Or the server answers quickly, and the browser then spends a long time processing the response locally.
Different explanations. Same experience. Click. Wait two seconds.
Saying “my internet is fast” doesn’t settle this. A connection can transfer large amounts of data per second while an individual interaction still waits on round trips, remote work, or local processing. Throughput tells us how much work or data gets through per unit of time. Latency tells us how long a particular operation takes.
So the useful question becomes: where did those two seconds actually go?
We need a timeline: when did the input arrive, the handler run, the response arrive, and the result appear?
Chrome’s Performance panel lets us inspect main-thread and network activity in a recording. A long task near a pause is a lead; we still need to connect it to the result’s dependencies.
A Small Investigation
Suppose Search takes two seconds. Here are two explanations we could distinguish:
| Hypothesis | What we would expect in the recording |
|---|---|
| Most of the delay is local browser work before the request starts. | A long interval of main-thread work before the request is sent. |
| Most of the delay is in the request path. | The request starts promptly but remains outstanding for most of the wait. |
Now consider this illustrative recording, with invented timings:
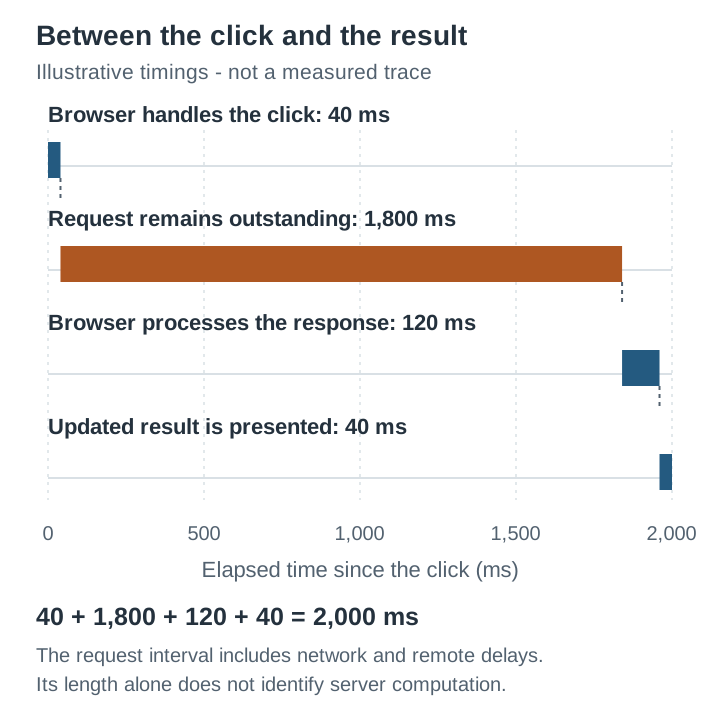
Assume the recording also shows the main thread mostly idle while the request is outstanding. That supports the second explanation for this interaction. We have located most of the wait, but haven’t identified its cause inside the request path.
A follow-up experiment would return the same payload through a controlled test stub, keeping the client processing unchanged. If the stub takes 20 ms, this simplified model predicts 40 + 20 + 120 + 40 = 220 ms to the result. A real test would need repeated comparable runs: a result near that prediction would strengthen the explanation; a result still near two seconds would send us back to the dependencies.
This is a worked reasoning example, not a measurement of a real website. An outstanding request can include network delay, remote queueing, and server work. Chrome’s network timing guidance explains why response waiting alone cannot identify server computation.
We are trying to account for elapsed time, without adding together activities that overlapped or assigning causes we haven’t observed.
Memory Can Make Us Wait in Different Ways
Suppose I have many tabs open and everything becomes sluggish. Very naturally I may say, “Okay, I need more RAM.”
Maybe. Quite possibly. But again… not necessarily.
Browsers manage memory too. Chrome’s Memory Saver, for example, can deactivate inactive tabs and reload them when you return. Waiting for a discarded tab to reload is different from typing into an active page that is busy executing code.
The operating system may reclaim memory or recover data that is no longer resident. Some accesses trigger page faults, asking it to resolve a virtual-memory access. These occur during normal operation and don’t always require storage reads, as Microsoft’s hard and soft page fault explanation describes. Excessive faults requiring storage access can cause delays; a fault count alone doesn’t diagnose insufficient RAM.
Go deeper into the processor and there is another memory question. The CPU gets instructions and data through a hierarchy of caches and main memory. A cache keeps copies close to the processor. A miss means the requested information was not found at the cache level being checked; it may still be available at another level.
It is easy to say, “Cache miss happened, therefore performance is bad.”
Not necessarily.
Modern processors can sometimes do independent work or overlap memory accesses while data is on its way. Fetching data ahead of use can help too, as Intel explains in its prefetch overview. These mechanisms depend on the processor and the work available.
Did that delay become exposed on the critical path? Did useful progress actually have to wait for the data?
Running out of RAM, reloading a discarded tab, and waiting on a cache miss are different mechanisms. The word “memory” doesn’t tell us which one explains the pause.
Part 3 will examine this through sequential access and dependent pointer chasing. An expensive event doesn’t automatically explain a delay to useful progress.
Collect Evidence That Changes the Explanation
We could keep guessing. CPU. RAM. Network. Browser extension. Operating system. Some website bug.
Or we can start investigating.
Suppose an interaction pauses for half a second. Does it happen on every website or only one? Does the same action behave differently with extensions disabled? Is the relevant thread busy during the pause? Is a network request outstanding? Do we see memory pressure?
Each observation changes which explanations still make sense. That is the purpose of measuring.
There is a fairly simple method underneath this:
Observe. Characterise. Hypothesise. Measure. Experiment. Explain.
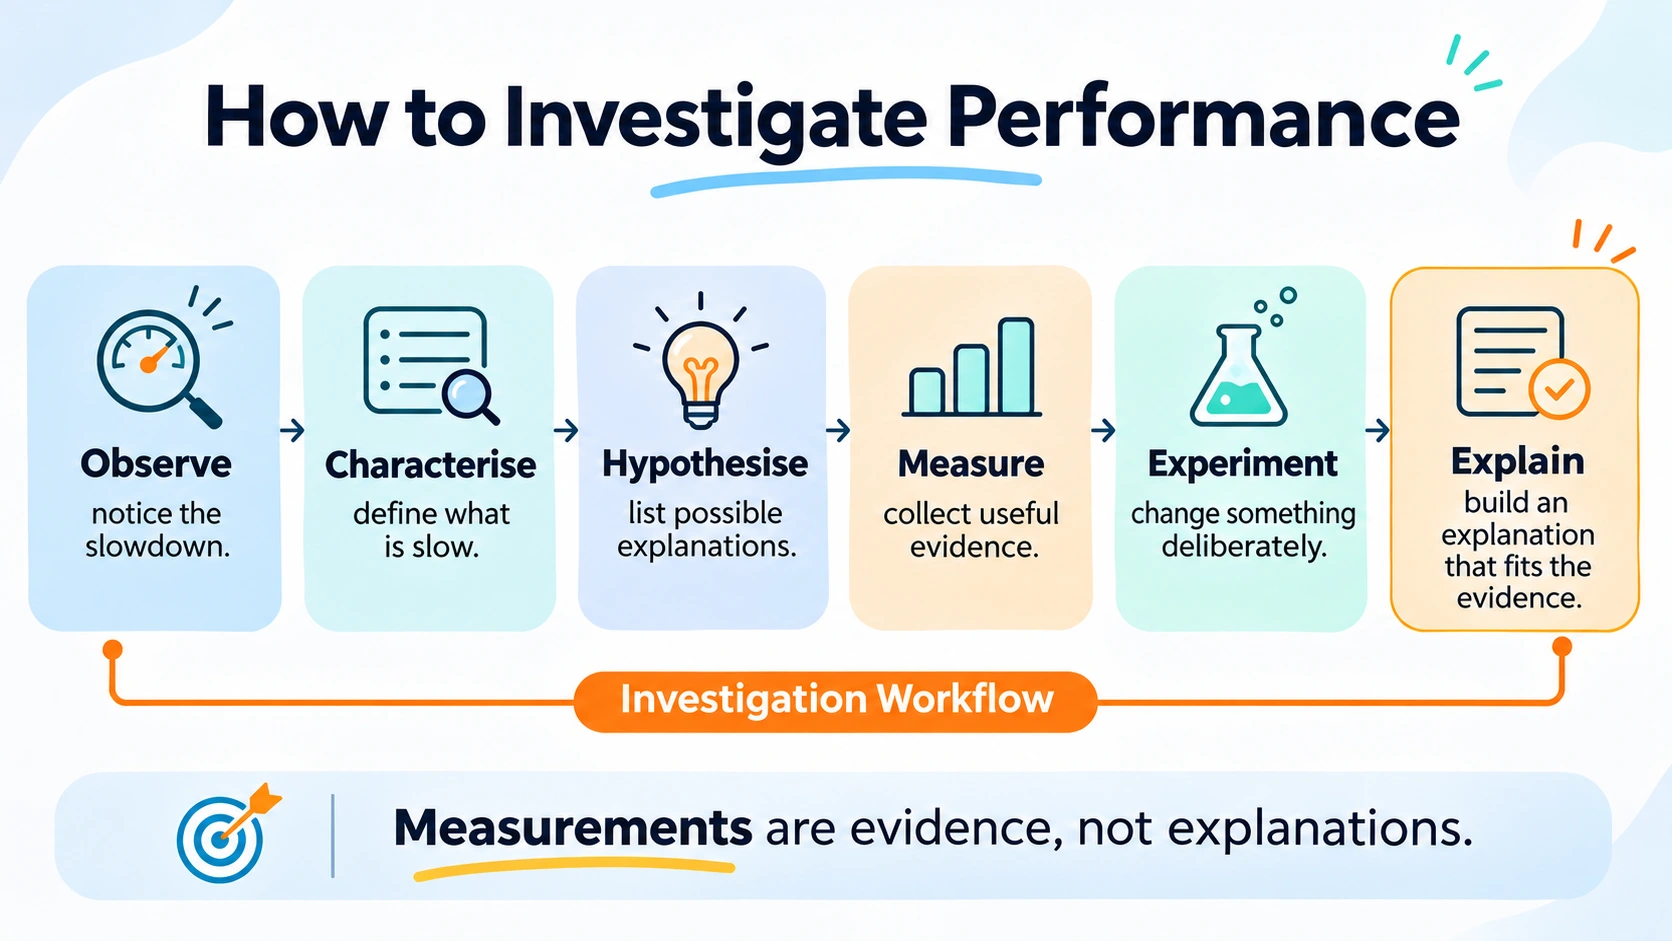
Characterise the action, delay, and conditions. Form possible explanations, then choose measurements that distinguish them.
Wherever possible, change one relevant condition and repeat the same action. Does the result agree with our expectation? One faster attempt is a clue; repeated comparable observations are stronger evidence. Check what else the change affected.
This is a loop. An observation may send us back to a different hypothesis.
If we start by saying, “I know this is a RAM problem,” it is easy to spend the next twenty minutes looking for numbers that prove us right.
The more useful question is: what result would make me say, “Okay. I was wrong”?
A Game Can Have High FPS and Still Stutter
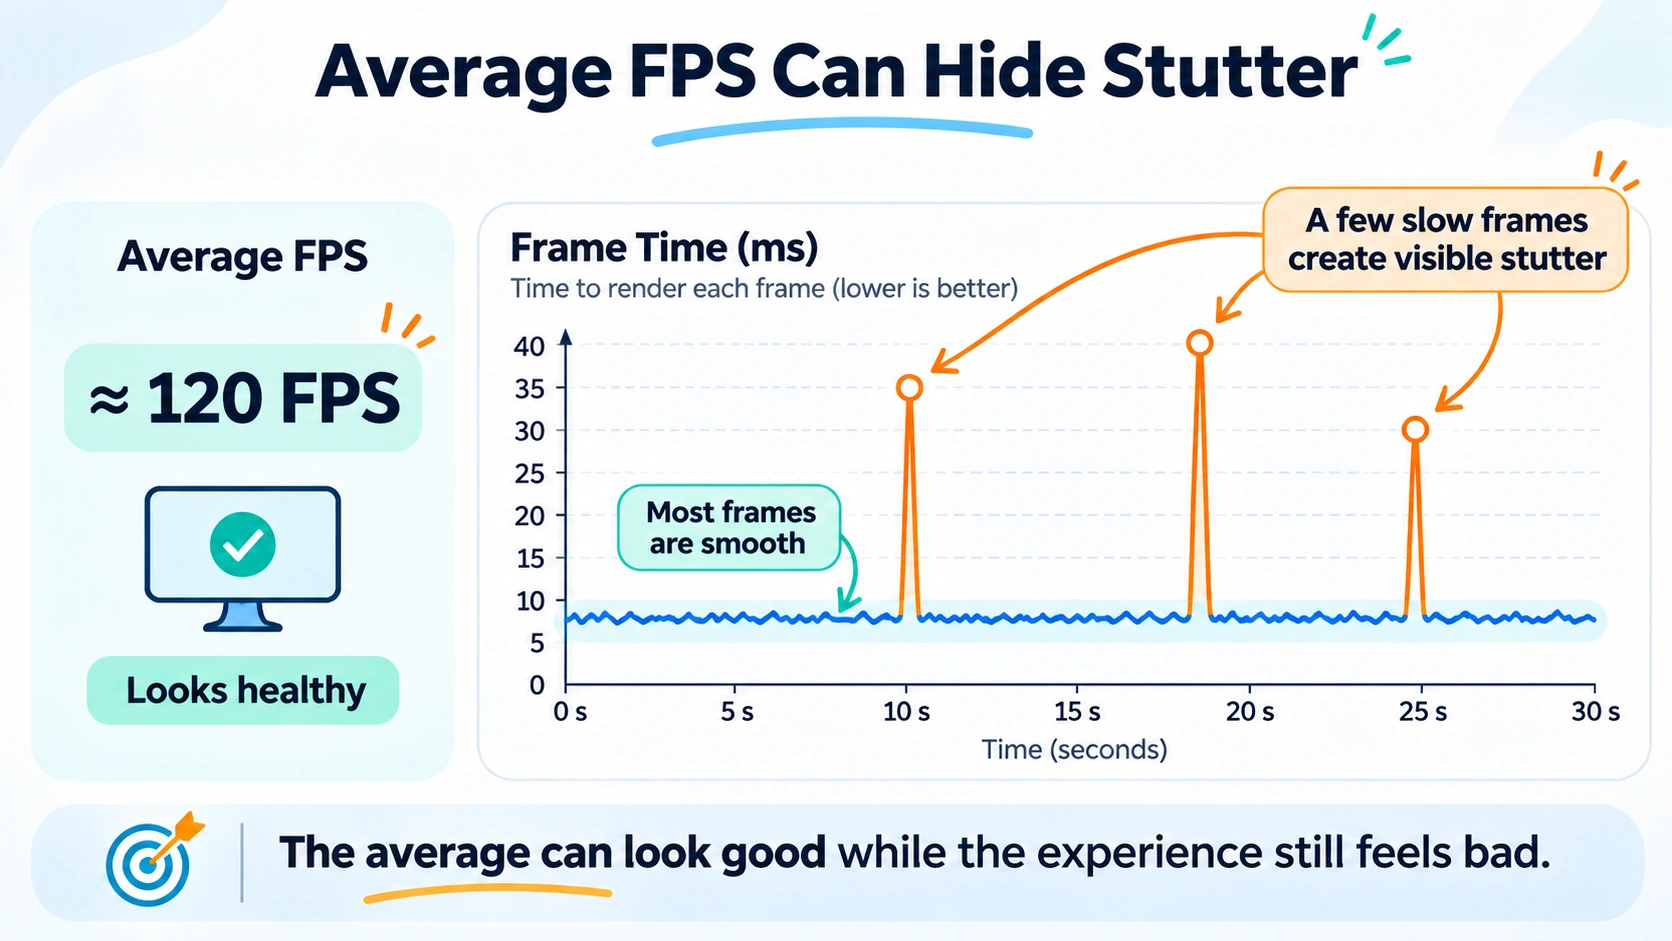
The same reasoning appears in gaming. Suppose a game reports around 120 frames per second, but every few seconds there is a visible stutter.
At a perfectly steady 120 FPS, a new frame would arrive about every 8.33 milliseconds. Now imagine most frame intervals are near that value, but occasionally one stretches to thirty or forty milliseconds. The average over a longer period can still look good. You experienced the long interval.
Average FPS isn’t wrong. It doesn’t completely describe the behaviour that bothered you.
That is why frame-time plots and distributions are useful. A percentile tells us where a chosen fraction of the measured values falls: a 99th-percentile frame time is a duration at or below which roughly 99% of the recorded frame times lie. Even that single number can leave out rare events. The timeline still matters. If you use a metric labelled “1% low”, check how the tool calculates it rather than assuming every tool means the same thing.
For an exact constructed comparison, see two traces with the same mean frame time. One is steady; the other includes a 40 ms interval.
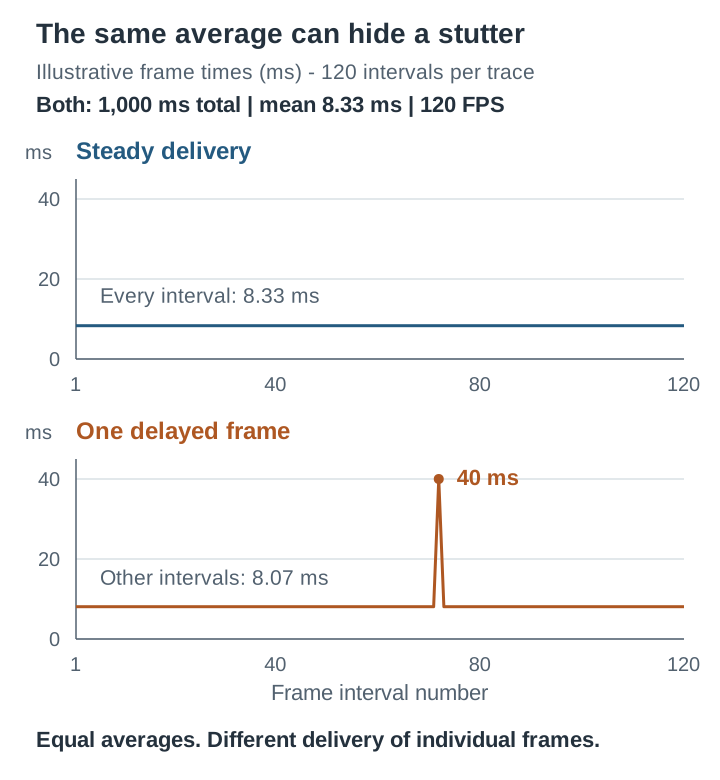
Then we ask what happened during those particular frames. Was it GPU work? A CPU-side dependency? Memory activity? Loading assets? Something else?
Same method. Different workload.
The Tools Come After the Question
Sometimes a simple timer is enough. Sometimes CPU profiling helps us identify functions where execution time is being spent. Sometimes we need tracing to understand when things happened and who was waiting for whom. A thread blocked on a response can contribute heavily to elapsed time while accumulating little CPU execution time.
Sometimes we need GPU profiling. Sometimes we go down to hardware performance counters, which record processor-specific events such as instructions, cycles, cache activity, and branches.
Choose a measurement because it answers the question you have reached. We will work through the tools in this series.
I can collect gigabytes of performance data and still have no idea what the problem is.
Before Part 2, try this with one slow interaction you encounter. Write down exactly what you did, what result you were waiting for, and when the delay occurs. List two plausible explanations and one observation that would help distinguish them. If you look at CPU utilisation, record what it says without treating that one number as the explanation. An honest “I haven’t measured it yet” is more useful than an invented timing.
That is already a better starting point than “my computer is slow”.
Before Optimisation Comes Understanding
We want lower latency, higher throughput, more consistent behaviour, or better scalability. What matters depends on the workload: the work we ask the system to do and the conditions under which it runs.
But first we need to understand what makes useful progress, what waits, and which delays become visible to the person using the system.
Sometimes the answer is a faster processor. Sometimes more parallelism, better memory locality, less synchronisation, a different algorithm, or simply doing less work. And sometimes the component everybody wanted to upgrade was completely fine.
Knowing what not to optimise can save a lot of time.
We live with powerful computers every day. We experience interactions: click, wait, response. Type, wait, result. Scroll, render.
The next time one of those interactions feels slow, ask: where did the time go?
Describe the problem. Consider explanations. Measure something useful. Change something deliberately. Build an explanation that agrees with the evidence.
That, for me, is where computer performance starts becoming really interesting.
Next, in Part 2: CPU Is Only 30% Busy. Can It Still Be the Bottleneck? We will ask whether the work we are waiting for can actually use the processor capacity we see sitting idle.
Warm regards, Bhargav
References
- Google, web.dev - Interaction to Next Paint (INP) and Optimize Interaction to Next Paint. The optimisation guide was updated on 2 September 2025; consulted 3 November 2026.
- Microsoft Learn - CPU Analysis. Consulted 3 November 2026.
- Google, Chrome for Developers - Performance features reference. Consulted 3 November 2026.
- Google, Chrome for Developers - Network features reference: timing breakdown. Consulted 3 November 2026.
- Google Chrome Help - Personalize Chrome performance. Consulted 3 November 2026.
- Microsoft, Ask the Performance Team - The Basics of Page Faults. Originally published 10 June 2008; republished 15 March 2019.
- Intel - Whitepaper: Hardware Prefetch Controls for Intel E-Cores. July 2026 revision.
Optional deeper reading: Vladimir Kiriansky, Haoran Xu, Martin Rinard, and Saman Amarasinghe - Cimple: Instruction and Memory Level Parallelism, July 2018. This research paper explores instruction and memory parallelism beyond the scope of this introduction; it is not needed to follow the series.
Comments powered by Disqus.